


Details
Date:
July 2, 2026
Author:
Mender Team
Enterprise teams often have plenty of IT asset data but no clear view of the full program. Updates sit across emails, spreadsheets, shared folders, and vendor portals, leaving teams unsure where assets are, which orders are delayed, whether documentation is complete, and how much value has been recovered.
This article explains what an IT asset lifecycle dashboard should show and how a decision-ready dashboard differs from a basic reporting view.
Most enterprise lifecycle programs do not lack reports. They lack a consistent view across those reports.
A single retirement program may involve internal IT teams, logistics providers, processors, data-destruction vendors, recovery partners, finance, compliance, and sustainability stakeholders. Each participant may use a different system, reporting format, or definition of completion.
As a result, teams spend time downloading reports, combining spreadsheets, requesting updates, and matching certificates to separate asset lists. An IT asset lifecycle dashboard should reduce this fragmentation instead of placing a cleaner interface over the same disconnected process.
The first responsibility of an IT asset lifecycle dashboard is to show where active work stands.
A total number of retired or processed assets is useful, but it does not explain which orders are moving, which are waiting, or where intervention is needed.
A decision-ready view should distinguish workflow stages such as:
The exact terminology may vary, but users should be able to understand the current workload and identify what is preventing an order from moving forward.
This becomes especially important when assets move across multiple sites, vendors, processors, or regions. Without a shared operational view, teams often need to contact each provider before they can answer a basic status question.
High-level figures become useful when users can move from the number to the records behind it.
For example, a dashboard may show 59 created orders. A user should then be able to identify those orders, review their locations, see the current owner, and determine whether any have exceeded the expected timeline.
The same principle applies to:
A dashboard should not become another report that requires interpretation elsewhere. It should provide a direct path from the summary to the relevant order, asset, or exception.
Recovery reporting should not arrive weeks after processing in a separate finance document.
A lifecycle dashboard should connect operational activity with financial metrics such as total value recovered, average asset value, order volume, monthly returns, and recovery trends.
That allows different teams to evaluate the same activity from their own perspective.
IT may need to know whether equipment reached processing. Finance may need to understand when proceeds will be recognized. Procurement may use expected recovery to support a refresh. Leadership may want to know whether the program is improving.
When those figures are connected, the organization can better explain why value changed instead of only reporting the final amount.
Mender’s ITAD services include secure disposition, value recovery, data protection, and reporting across enterprise programs.
A total asset count does not show what makes up the program.
Asset-class reporting should help teams understand the volume of laptops, mobile devices, monitors, servers, networking equipment, desktops, and other categories entering the lifecycle.
That information can influence:
A mobile-device program may require a different approach from one dominated by servers or networking equipment.
A completed status does not prove that every compliance requirement has been met.
Users may still need to confirm whether all expected assets arrived, whether serial numbers matched, whether data sanitization was completed, whether exceptions occurred, and whether required certificates are available.
A lifecycle dashboard should connect the asset or order to supporting evidence such as:
This connection is central to audit readiness.
Compliance teams should not need to match one vendor’s certificate to another system’s inventory and a separate pickup spreadsheet.
Operational completion and documented completion are not always the same.
An asset may have finished processing while its reconciliation report, sanitization certificate, or final disposition record remains incomplete.
The dashboard should make that difference visible.
Teams should be able to see whether:
Environmental outcomes should not require another manually compiled spreadsheet.
A connected dashboard can use the same lifecycle records to report:
Keeping these metrics beside operational and recovery information gives sustainability, finance, compliance, and IT teams a consistent source of data.
It also helps organizations connect environmental outcomes to specific disposition decisions rather than reporting them separately at the end of the year.
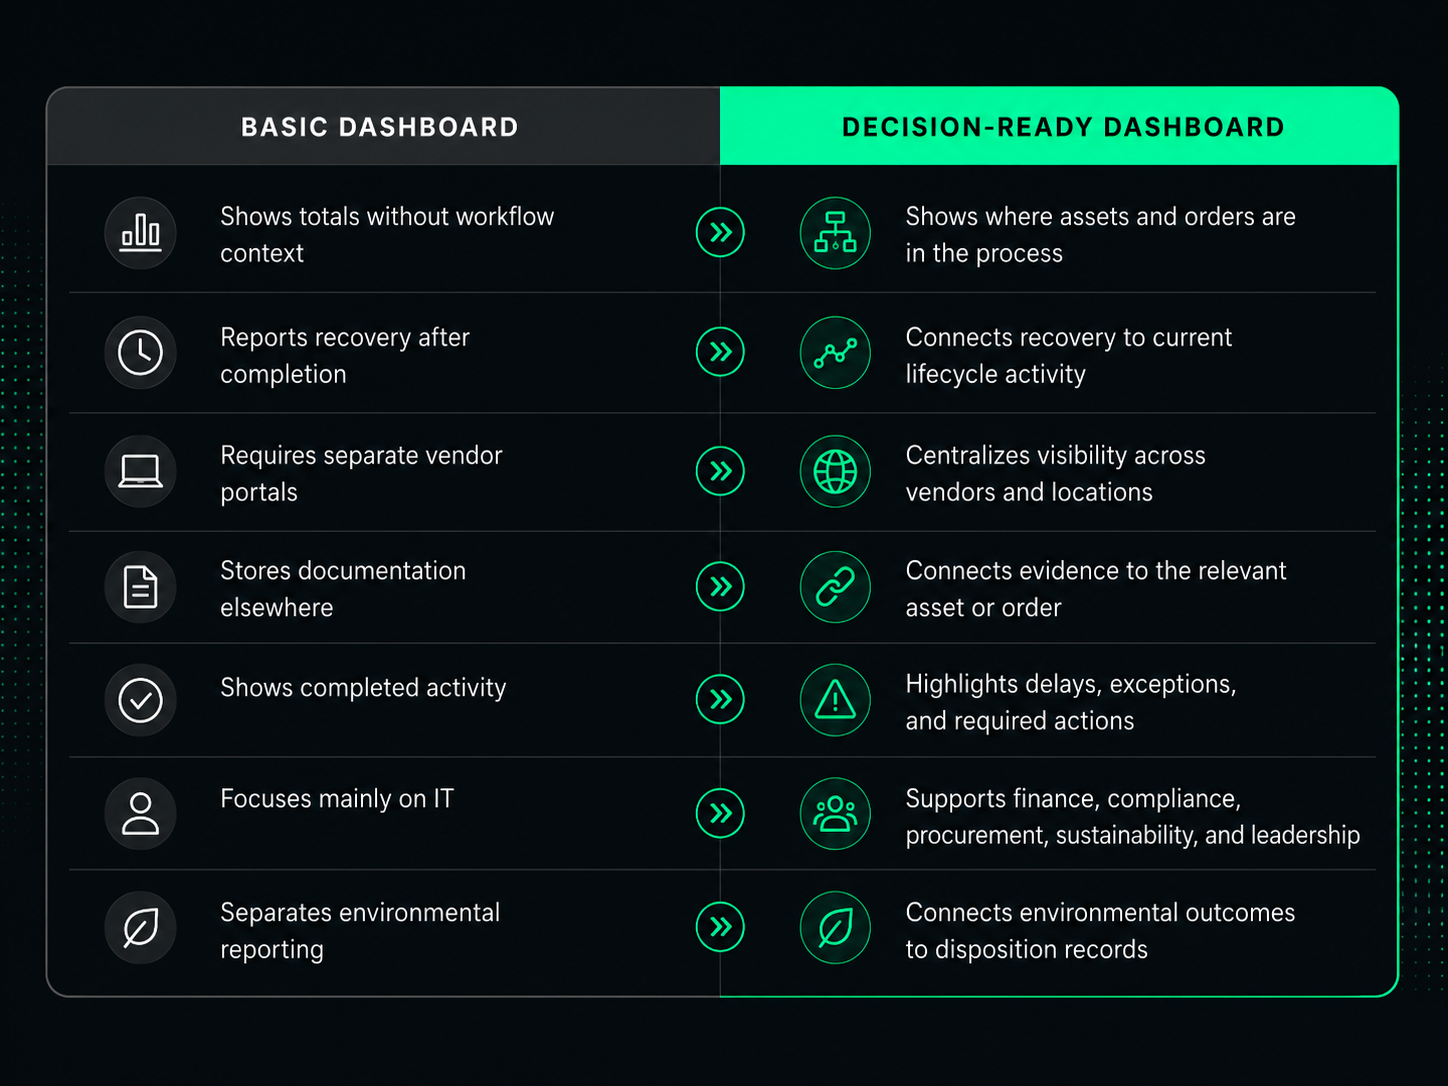
Use these questions during a dashboard review:
Steward™ is mender’s IT Asset Lifecycle Command Center.
It brings active workflow visibility, asset status, documentation, recovery reporting, environmental outcomes, and final disposition into one environment.
Its role is to reduce dependence on disconnected spreadsheets, vendor updates, and reporting portals while extending visibility beyond systems such as ServiceNow and existing CMDBs.
An IT asset lifecycle dashboard is a centralized view of asset activity, service orders, workflow status, recovery value, documentation, and disposition outcomes.
It should help enterprise teams understand what is happening without manually combining information from multiple vendors and systems.
It should track current workflow status, service orders, asset categories, chain-of-custody activity, data sanitization records, financial recovery, final disposition, and environmental outcomes.
The most useful metrics connect directly to the underlying order or asset.
An ITAM dashboard usually focuses on assets during active use, including ownership, location, configuration, maintenance, and software or hardware management.
An IT asset lifecycle dashboard extends visibility into retirement, collection, transportation, processing, sanitization, recovery, reuse, recycling, and final disposition.
IT, infrastructure, finance, procurement, compliance, security, sustainability, and leadership teams may all use the dashboard differently.
The important point is that they work from a consistent lifecycle record.
No. Steward™ is designed to complement those systems by extending visibility into downstream lifecycle execution, recovery, documentation, and disposition outcomes.
Enterprise teams should not need to chase vendors, reconcile spreadsheets, or wait for a monthly report to understand what is happening across retired assets.
A decision-ready dashboard connects operational status, compliance evidence, recovery performance, and final outcomes so stakeholders can act with greater confidence.
Mender provides the operational ITAD services behind the work, while Steward™ gives teams one command center for following the lifecycle from active order through final disposition.
Connect with our team to schedule a Steward™ walkthrough and see how a connected lifecycle view can support your ITAD program.
Spot the sneaky risks and learn to outsmart them.
Get a free asset quote today and let's get mending.
.jpg)